로고


ㆍ조회: 4235  
  • 글제목
  • Paste 및 Suspension 재료의 분산성 평가를 위한 방법과 측정 기기 및 원리에 대한 자료
  • 작성자
  • MCIK
  • 작성일
  • 2010-08-13 (금) 16:47
  • 첨부#1
  • Brochure.zip (1,964KB) (Down:72)
    (1) 독일 Dataphysics사  MultiScan MS-20 Measuring Instru
     
    ment for Particle and Stability Characterization
     
    분산 및 유화 안정성 측정기 New innovative particle and droplet sizer
    in multiphase system 유화 안정성 분산 물질의 Stability, Shelf-life 등을 측정하는
    신개념 장비 MS-20
     
     
    MultiScan Ms20  은  희석하지 않은 고농도 Liquid Dispersion의 Homogeneity 와 분산안정성을
    연구하는데 이용되는 분산 상태를 나타내는 절대값을 구하는 신개념의 장비 입니다.
    이 절대값은 분석하고자 하는 시료의 분산 상태를 나타내는 "Fingerprint"로
       1) Microstructure에 의존하며 (Flocs, Gels 등)
       2) Particle Size에 의존하며
       3) 농도(Volume Fraction)에 의존하며
       4) Absorption (입자에 의한 빛의 흡수)에 의존하며
       5) Non-absorbing한 시료의 경우 평균 입경을 계산하는데 이용 되는
    유체의 분산성 연구에 사용되는 강력한 분석  도구 입니다.
     
    (2) HAAKE 광학 레오미터를 이용하는 방법:
     
    유변 물성 측정기와 정밀 광학 현미경을 함께 결합시킨 Thermo 의 최첨단 기술력을 바탕으로  개발된 광학 레오미터 입니다.  재료의 점탄성, 퍼짐성, 흐름성 등 유변학적인 물성 변화에 대한 바른 해석과 이해는 오랜 세월 동안 레오미터 만으로는 해결이  불가능했던 어려운 과제 였었습니다. 시료의 미세 구조 변화를 유발하는 전단력 (Shear) 의 영향의 올바른 분석 을 위해서는  지금까지 숙련된 기술과 많은 부가적인 분석 장비가 필요했었습니다. 하지만, 신개념의 광학 유변 물성 측정기 하케 레오스콥 1 의 탄생은 단지 하나의 분석 기기와 한번의 시험만으로 점도 분석에서 부터 전단력이 작용하고 있는 동안의 입자 모양 및 사이즈 변환까지도 모두 측정 가능하게 하고 있습니다.

    ◊유변학 시험 및 광학 시험의 동시 수행
    ◊전단력 (Shear) 이 가해진 시료의 미세구조 변이 과정의 고찰
    ◊전단력 (Shear) 영향 아래 놓인 시료중 입자 동역학의 정량적 고찰


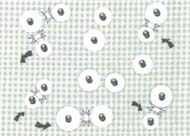
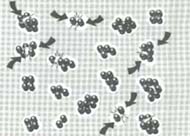
    분산상의 변형 및 정렬 성향 고찰

    현미경 렌즈를 통한 미세 구조의 고찰은 레오미터만을 이용해 얻어진 유변학 시험
    결과 만으로는 추론이 불가능한 관련 유변 시험중 시료 각부위의 미세구조
    변이과정의 고찰을 가능하게 한다.

    Food 재료 이멀션의 결정적 구조 변이 과정인 병합 (Coalescence) 과정은 하케 레오스콥 
    Module 로 간단하게 고찰 될 수 있다. 하지만 일반 레오미터로 구해지는 본 시료에 대한 점도 변화 곡선의 고찰 만으로는 시간의 경과에  따른 점도 감소 거동이 시료의 특별한 구조적인 변이 과정에 기인하고 있다는 사실을 설명할수 없다.

    전단력에 의해 유도된 구조 형성

    흐름이 진행되는 도중에 미세 구조 변이 과정에 대한 현미경을 통한 고찰은 기술
    연구 과정에 있어서 점진적으로 아주 중요한 분야로 인식 되어 지고 있다.
    하케 레오스콥  모듈에 적용된 새로운 칸셉으로 인하여 시료의 유변학적인
    성질과 구조 변환 과정과의 관계 설정이 보다 명확하게 정의될수 있게 되었다.
    왼쪽 그림에 나타난 하케 레오스콥 1 을 이용한 전단력에 의해 유도된 입자들의
    응착 과정에 대한 현미경적인 고찰은 산업체에서 사용되어지고 있는 시료의
    복잡한 점도 변이과정에 대한 증거를 명쾌하게 찾아낼 수 있게 하고 있다.

    표면 성질 및 거동의 연구

    현미경 렌즈를 통한 미세 구조의 고찰과  함께 레오미터를 이용한 유변학 시험의
    동시 수행은 전단력이나 수평 진동 전단 시험 (Oscillation) 중에 발생되는 복잡한
    구조 변환에 대한 확실한 메커니즘을 알려주는 이상적인 조합 기능 이다.

    이러한 두가지 장치의 이상적인 조합은  화장품 이멀션 입자들의 전단력
    영향하에서 보여지는 신장과 정지상태 에서의 이완 (Relaxation) 과정에서 고찰
    되는 예 에서와 같이 시료의 전단력 관련 History 및 동적 구조 변환에 대한 연구
    수행을 가능하게 한다.
     pc™ Film Thickness Analyzer
     
    (3)  Zeta Potential & Particle Size Analysis with  Real Ti
     
    me Observation 
     
    신개념 실시간 영상 분석을 통한 입도 및 제타 포텐셜
     
    측정 장치 
     
    - Characterization of particles and dispersion stability of colloidal systems
     
    입자의 Zeta potential이 높을수록 분산도가 좋아지고 Zeta potential이  "0" 에 가까와 질수록  입자간의 인력이 높아져서  Cluster 가 생성되어 분산성이 저하 됩니다. 
     
    - New "ZEECOM"  ZC-3000 의 특징
     
    1. CCD 카메라를 사용하여 LCD화면에서 자동으로 여러개의 입자의 크기와 이동 방향 및 속도를 확인하면서    입도 및  Electric mobility 결정 과정 확인 가능.
    2. Laser를 사용하여 20 nm 입자까지 측정이 가능.
    3. LCD 모니터를 통해 직접 확인하며 측정하기 때문에 비극성 용매등의 효과로 유발되는 예상치 못한 측정 장애 요소 극복이 가능.
    4. Laser Doppler나 PALS 및 초음파를 이용한 측정 장치를 이용한 방법은 시험기기 내부에서 일어나는 이상 현상을 전혀 감지할수 없기에   소프트웨어에 표시되는 결과를 그냥 인정 해야만했던 (Black box 내부에서와 같이 시험중 어떤 현상이 일어나는지 확인할  방법이 없었음) 기존 시험 방법의 어려움을 극복 하실수 있습니다.


    Zeta Potential & Particle Size Analysis with ZEECOM
     
    Technology
     

    Colloidal particles dispersed in a solution are electrically charged due to their ionic characteristics and dipolar attributes.
     
    Each particle dispersed in a solution is surrounded by oppositely charged ions called the fixed layer. Outside the fixed layer, there are varying compositions of ions of opposite polarities, forming a cloud-like area. This area is called the diffuse double layer, and the whole area is electrically neutral.
     
    When a voltage is applied to the solution in which particles are dispersed, particles are attracted to the electrode of the opposite polarity, accompanied by the fixed layer and part of the diffuse double layer, or internal side of the "sliding surface".


    Dispersed particles

    Aggregated particles

    Zeta potential is considered to be the electric potential of this inner area including this conceptual"sliding surface". As this electric potential approaches zero, particles tend to aggregate.
     
    The static layer is computed using the following formula (which is embedded in the Zeecom software).


    The static layer is computed using the following formula (which is embedded in the Zeecom software).


    Zeta Potential (Smoluchowski’s Formula)


    This Zeecom unit uses a microscope to observe particle electrophoresis migration on a monitor while performing image processing to determine the particle migration speed, which is then converted into the zeta potential value.
     
    To eliminate errors due to electroosmotic flow caused by any electrostatic charge on the measurement cell, the zeta potential is measured at the static layer, whose position can be calculated from the width and depth of the cell. (The software performs this calculation automatically)

    Zeta Potential & Particle Size Analyzer : ZEECOM Software Features

    Analytical software
    • Obtain distribution of particle migration speeds.
    • Automatically calculates the isoelectric point by changing the pH of the solvent.
    • Automatically calculates distribution of zeta potential values for histogram display

    Measurement mode
    • After first setting the start and goal lines, particle values can be checked manually by clicking with the mouse when the particles pass a line (potential of individual particles can be checked).
      click to enlarge


      Visually identify target particle and record electrophoresis mobility

      Electrophoresis mobility of target individual particle is recorded and accumulated each time it passes Start Line (S) and Goal Line (G) by simple mouse-click.

      User can identify the actual measurement targets, whether dispersed or aggregated particles, with eye observation on real time basis.

    Selecting one of the four methods
    The automatic measurement is usually prepared by selecting one of the four methods.
    Flow velocity distribution
    (in the cell)

    Isoelectric point

    Histogram
    (distribution of zeta potential)
    alyzer